GEOTECHNICALENGINEERING1
ADELAIDE
HomeLaboratoryAtterberg limits

Atterberg Limits Testing in Adelaide: Soil Consistency & Foundation Design

Site investigations you can build on.

LEARN MORE

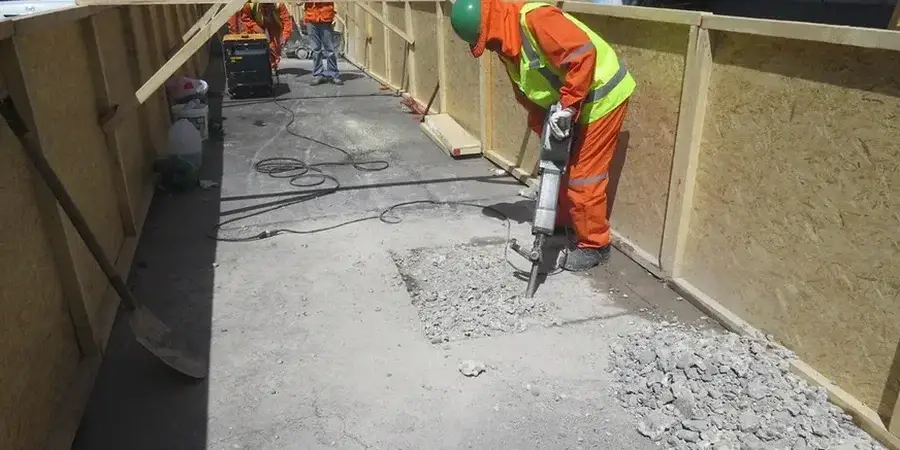
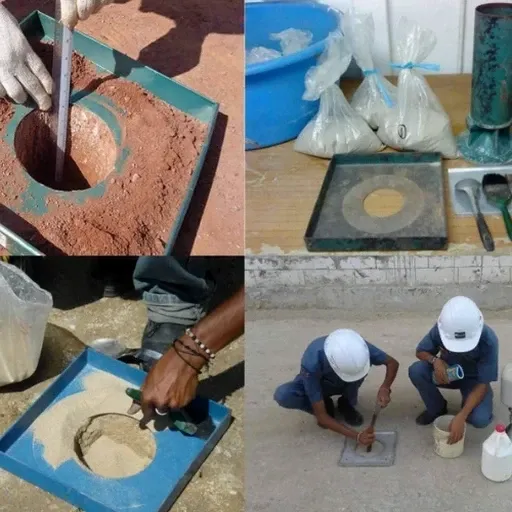
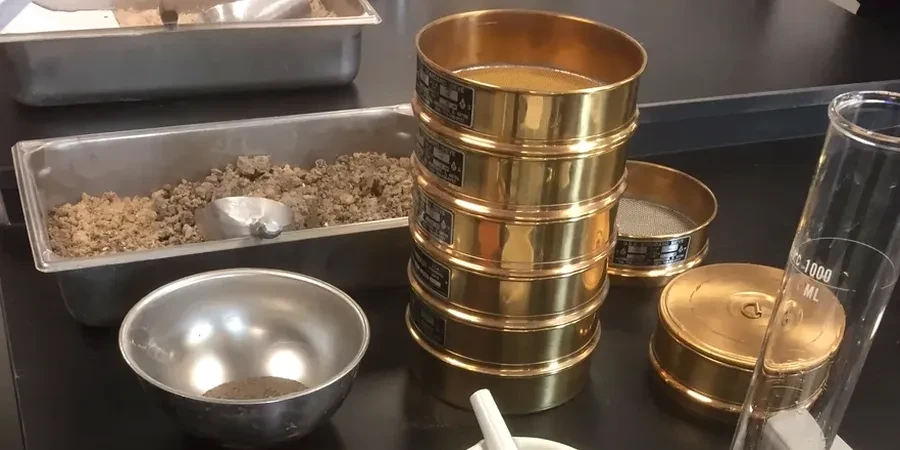
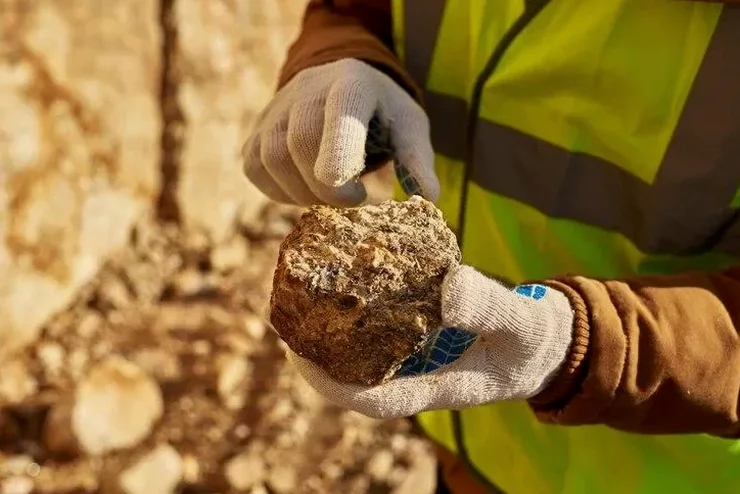
The Adelaide Plains present a geotechnical puzzle that catches out plenty of builders who have only worked with sands and gravels. The Keswick Clay formation runs beneath much of the metropolitan area, a stiff to very stiff silty clay that swells and shrinks with seasonal moisture changes. Add the alluvial deposits along the River Torrens and you’re dealing with clays that can move more than the structural engineer expects. In our experience across projects from Mawson Lakes to the southern suburbs, getting the Atterberg limits right is the single most reliable way to classify these reactive soils before a footing design ever hits the drawing board. The liquid limit, plastic limit, and plasticity index tell us exactly how the soil will behave when the winter rains arrive or a summer heatwave bakes the surface for six weeks straight. We run every sample through AS 1289 methods 3.1.1, 3.2.1, and 3.3.1, and we’ve refined our sample preparation over hundreds of Adelaide jobs to handle the high fines content without letting the clay dry out prematurely. A proper Atterberg profile paired with a grain size analysis gives the full picture of gradation and plasticity before you commit to a footing depth.

A plasticity index above 20% in an Adelaide residual clay is our red flag for footing movement—no amount of reinforcement replaces a design that accounts for the shrink-swell cycle.

Our service areas

How we work

Adelaide’s growth since the 1970s pushed residential subdivisions straight into the reactive clay belts that older development had mostly avoided. Suburbs like Golden Grove, Flagstaff Hill, and parts of Burnside sit directly on residual clays derived from weathered siltstone and shale of the Adelaide Geosyncline. When we test Atterberg limits on these materials, it is not unusual to see liquid limits above 50% and plasticity indices in the 20–35% range—numbers that put the soil firmly in the high-reactivity class under AS 2870. The real value of the test is not just the number, though. We watch how the soil behaves during the rolling thread procedure. A clay that crumbles quickly at the plastic limit tells a different story from one that stays cohesive right down to low moisture, even if both yield the same plasticity index. For deep excavations in the CBD, we often pair Atterberg classification with in situ permeability testing to understand how quickly water will migrate through the cohesive profile during construction. In road projects across the northern expressway corridor, the plasticity index drives our recommendation on whether a lime stabilisation programme is needed before the pavement layers go down. A CBR assessment without Atterberg data misses half the story when the subgrade is a reactive clay.
Atterberg Limits Testing in Adelaide: Soil Consistency & Foundation Design
Technical reference — Adelaide

Local geotechnical context

The Keswick Clay and its associated formations across the Adelaide metropolitan area have a proven track record of damaging lightly loaded structures that were designed without a proper reactivity assessment. AS 2870 classifies sites based on the characteristic surface movement Ys, and that number is derived directly from the plasticity index and the soil profile. A PI of 25% in a 2-metre clay layer over rock can produce 40–60 mm of surface movement between wet and dry extremes. On the alluvial flats west of the city, we encounter soft clays with natural moisture contents near or above the plastic limit, meaning the soil is already in a plastic state before construction even starts. This is where the liquidity index becomes a critical number—if the LI is close to 1.0, the clay has very little undrained shear strength and will consolidate significantly under load. Foundation options shift quickly from stiffened rafts to stone columns or piled solutions when Atterberg results combine with low strength and high compressibility in the site investigation report.

Need a geotechnical assessment?

Reply within 24h.

Email: contact@geotechnicalengineering1.co

Relevant standards

AS 1289.3.1.1:2009 (Liquid limit – four-point Casagrande method), AS 1289.3.2.1:2009 (Plastic limit and plasticity index), AS 1289.3.3.1:2009 (Liquid limit – one-point Casagrande method), AS 2870-2011 (Residential slabs and footings – site classification by Ys), AS 1726-2017 (Geotechnical site investigation – soil classification)

Typical values

ParameterTypical value
Test standardAS 1289.3.1.1, 3.2.1, 3.3.1, 3.4.1
Liquid limit (LL)Moisture content at transition from plastic to liquid state
Plastic limit (PL)Moisture content at transition from semi-solid to plastic state
Plasticity index (PI)PI = LL − PL; key indicator of soil reactivity
Liquidity index (LI)In situ state relative to Atterberg limits; LI ≈ 0 = preconsolidated
Sample preparationAir-dried, pulverised, sieved through 425 µm, mixed with distilled water
Typical Adelaide PI range6–40% depending on formation (Keswick Clay vs Torrens alluvium)
ReportingLL, PL, PI, LI, soil classification per AS 1726 and Unified System

Quick answers

What do Atterberg limits actually tell me about the soil on my Adelaide site?

The liquid limit and plastic limit define the moisture content boundaries between the soil’s solid, plastic, and liquid states. The plasticity index – the difference between those two numbers – is the single most important index for predicting shrink-swell potential. A high PI means the soil can absorb a lot of water before losing strength, and it will shrink significantly when it dries. For a footing designer working on reactive Adelaide clays, the PI feeds directly into the site classification under AS 2870 and determines whether a standard slab, a stiffened raft, or a piled solution is appropriate.

How much does Atterberg limits testing cost in Adelaide?

For a standard Atterberg suite covering liquid limit, plastic limit, and plasticity index on a single sample, you can expect to pay between AU$110 and AU$180. The exact figure depends on sample preparation requirements and whether we are testing one sample or batching multiple samples from the same borehole. Projects with several boreholes typically benefit from volume pricing, and we can provide a firm quote once we see the investigation scope.

How long does the test take and how much soil do you need?

We need about 300 grams of material passing the 425-micron sieve, which usually means a representative bag sample of roughly 500 grams from the field. The test itself runs over two working days because the soil must hydrate thoroughly before we start the Casagrande procedure. Standard reporting turnaround is three working days from when the sample arrives at our Adelaide laboratory. We can expedite to 24 hours when the investigation programme is tight.

Can I use Atterberg limits alone to classify my site under AS 2870?

Atterberg limits are a critical part of the classification but not the whole picture. AS 2870 requires a full soil profile log including layer thicknesses, depth to rock or competent bearing stratum, and an assessment of the characteristic surface movement Ys. The plasticity index from your Atterberg testing is the main input into the Ys calculation, but you also need to know how deep the reactive clay extends and whether there are any unusual moisture conditions. We recommend pairing the Atterberg suite with borehole logging and, on larger projects, a site-specific suction profile.

Location and service area

We serve projects in Adelaide and surrounding areas.

View larger map