GEOTECHNICALENGINEERING1
ADELAIDE
HomeGeophysicsSeismic tomography (refraction/reflection)

Seismic Tomography for Adelaide Basin Projects: Refraction and Reflection Profiling

Site investigations you can build on.

LEARN MORE

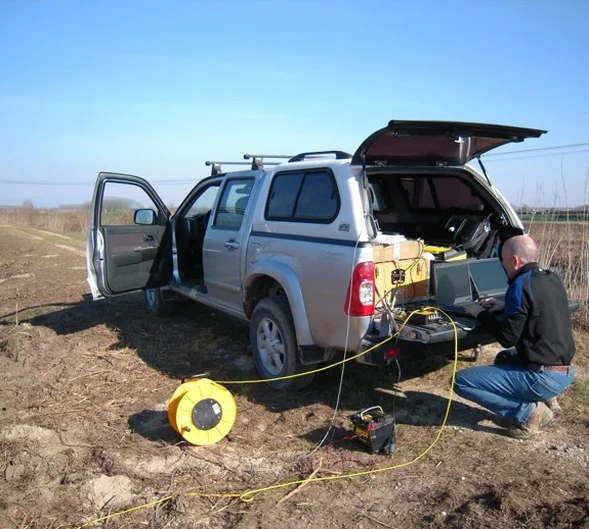
The geology beneath Adelaide doesn't read like a simple textbook chapter. From the thick Tertiary limestones of the western suburbs to the fractured Proterozoic basement rocks rising in the Mount Lofty Ranges, the contrast is sharp and unforgiving. Our team regularly deploys seismic tomography along the foothills corridor, where colluvial deposits mask the true bedrock profile. This geophysical method maps subsurface velocity contrasts that correlate directly with material stiffness, helping engineers avoid surprises when excavation hits unexpected pinnacles or buried paleochannels. The interplay between the St Vincent Basin sediments and the underlying bedrock creates a setting where seismic refraction alone often needs the companion detail of reflection processing to resolve deeper targets past 30 metres.

Seismic velocity imaging turns a sparse set of borehole logs into a continuous cross-section, revealing the bedrock topography that controls groundwater flow and foundation behaviour across the Adelaide Plains.

Our service areas

How we work

The geological setting of the Adelaide region features a sedimentary basin over 500 metres thick in places, with the Hindmarsh Clay and Hallett Cove Sandstone forming distinct velocity layers that are readily imaged with both refraction and reflection tomography. In our experience, a typical survey across the plains involves 24 to 48 geophone spreads with a sledgehammer or weight-drop source, achieving penetration to 40 metres in compacted fills.
For deeper infrastructure planning, such as tunnel alignments under the parklands, reflection processing with a higher-energy source can delineate the contact between the Quaternary cover and the Eocene Blanche Point Formation. Key deliverables from a survey include a 2D velocity cross-section with clearly interpreted geotechnical boundaries, Poisson's ratio profiles derived from combined p-wave and s-wave acquisition, and rippability charts referenced to the Caterpillar D9R performance data. The velocity range for stiff clays in the basin typically falls between 800 m/s and 1,300 m/s, while competent quartzite returns values exceeding 2,800 m/s, providing an immediate and quantifiable contrast for the design team.
Seismic Tomography for Adelaide Basin Projects: Refraction and Reflection Profiling
Technical reference — Adelaide

Local geotechnical context

Sites in North Adelaide and the inner eastern suburbs like Norwood sit on the Quaternary alluvium of the River Torrens, while a project in Blackwood or Belair sits squarely on weathered siltstone and sandstone of the Mitcham Quartzite complex. The risk profile for ground movement shifts dramatically between these two settings.
In the alluvial plains, unconsolidated silty clays can mask a highly irregular bedrock surface, leading to differential settlement if foundation design relies on sparse borehole data alone. Conversely, in the hills zone, near-vertical jointing and rapid lateral changes in weathering grade create pathways for water ingress and slope instability. We have seen resistivity contrasts fail to differentiate a dense clay from a weak mudstone, a problem that seismic p-wave velocity profiling solves clearly. The biggest hazard we help clients navigate is constructing on variable ground without understanding the three-dimensional geometry of these contacts, which is precisely where a dense tomographic array proves its value.

Need a geotechnical assessment?

Reply within 24h.

Email: contact@geotechnicalengineering1.co

Relevant standards

AS 1726-2017 – Geotechnical site investigations, AS 4678-2002 – Earth-retaining structures, AS/NZS 1170.4:2007 – Structural design actions, Part 4: Earthquake actions in Australia, AS 1289 – Standard Guide for Using the Seismic Refraction Method, AS 1289 – Standard Guide for Using the Seismic Reflection Method

Typical values

ParameterTypical value
Typical investigation depth (refraction)25 to 45 metres with sledgehammer source
Typical investigation depth (reflection)80 to 200 metres with accelerated weight drop
Geophone spacing2 to 5 metres, adjusted to target resolution
P-wave velocity in Hallett Cove Sandstone1,400 to 2,100 m/s (moderately weathered)
P-wave velocity in Hindmarsh Clay900 to 1,350 m/s (stiff, intact)
Data acquisition formatSEG-2 or SEG-Y, 24-bit resolution
Interpretation standardAS 1726-2017 Geotechnical Site Investigations

Quick answers

How much does a seismic refraction survey cost for a residential block in the Adelaide foothills?

A standard residential-scale survey with 24 geophones and a sledgehammer source typically ranges from AU$4,570 to AU$5,800, depending on access and the required penetration depth. For larger commercial lots requiring reflection processing, the budget extends toward AU$7,100.

Can seismic methods differentiate between the Hindmarsh Clay and the underlying bedrock?

Yes, very effectively. The Hindmarsh Clay exhibits p-wave velocities around 900 to 1,350 m/s, while the transition to weathered Hallett Cove Sandstone or fractured basement quartzite produces a sharp velocity increase to above 2,000 m/s. This impedance contrast generates a clear refractor that our processing software picks with high confidence.

What is the minimum area required to run a seismic line in an urban Adelaide yard?

We can work within a 25-metre straight line for a basic refraction profile, which suits most suburban lots in areas like Unley or Prospect. If space is tighter, we shorten the spread and use a higher-frequency geophone array, accepting a shallower penetration depth of around 15 to 20 metres.

Location and service area

We serve projects in Adelaide and surrounding areas.

View larger map